这是 hctf2018 的一道取证题。

链接:https://pan.baidu.com/s/1RUpt-IXUIpqH6SW91jRCcg

分析 mem.data

得到一个两百多 MB 的文件:mem.data,还是使用我们的老朋友 volatility 内存取证工具。

首先用 imageinfo 查看镜像信息:

1
$ volatility -f mem.data imageinfo
1
2
3
4
5
6
7
8
9
10
11
12
13
14
15
16
17
Volatility Foundation Volatility Framework 2.6
INFO : volatility.debug : Determining profile based on KDBG search...
Suggested Profile(s) : Win7SP1x64, Win7SP0x64, Win2008R2SP0x64, Win2008R2SP1x64_23418, Win2008R2SP1x64, Win7SP1x64_23418
AS Layer1 : WindowsAMD64PagedMemory (Kernel AS)
AS Layer2 : FileAddressSpace (/root/Documents/CTF/hctf2018/misc/eazy_dump/mem.data)
PAE type : No PAE
DTB : 0x187000L
KDBG : 0xf80004035070L
Number of Processors : 4
Image Type (Service Pack) : 0
KPCR for CPU 0 : 0xfffff80004036d00L
KPCR for CPU 1 : 0xfffff880009ee000L
KPCR for CPU 2 : 0xfffff88004568000L
KPCR for CPU 3 : 0xfffff880045dd000L
KUSER_SHARED_DATA : 0xfffff78000000000L
Image date and time : 2018-11-07 08:26:52 UTC+0000
Image local date and time : 2018-11-07 16:26:52 +0800

发现这可能是 Win7SP1x64 的系统。

然后用 pslist 扫描进程。

1
$ volatility -f mem.data --profile=Win7SP1x64 pslist
1
2
3
4
5
6
7
Volatility Foundation Volatility Framework 2.6
Offset(V) Name PID PPID Thds Hnds Sess Wow64 Start Exit
------------------ -------------------- ------ ------ ------ -------- ------ ------ ------------------------------ ------------------------------
0xfffffa8003344390 wordpad.exe 1804 1696 3 120 1 0 2018-11-07 08:15:35 UTC+0000
0xfffffa8000d9ab30 MineSweeper.ex 312 1696 9 208 1 0 2018-11-07 08:15:39 UTC+0000
0xfffffa8002de1560 mspaint.exe 2768 1696 6 122 1 0 2018-11-07 08:16:05 UTC+0000
0xfffffa8000cfeb30 cmd.exe 2824 1356 0 -------- 0 0 2018-11-07 08:26:51 UTC+0000 2018-11-07 08:26:52 UTC+0000

发现了 wordpad 记事本、MineSweeper 扫雷、mspaint 画图、cmd 这几个可能有线索的进程。用 memdump 全部 dump 下来进行分析:

1
$ volatility -f mem.data --profile=Win7SP1x64 memdump -p 1804,2768,312,2824 -D ./data
1
2
3
4
5
6
7
8
9
Volatility Foundation Volatility Framework 2.6
************************************************************************
Writing wordpad.exe [ 1804] to 1804.dmp
************************************************************************
Writing mspaint.exe [ 2768] to 2768.dmp
************************************************************************
Writing MineSweeper.ex [ 312] to 312.dmp
************************************************************************
Writing cmd.exe [ 2824] to 2824.dmp

经过分析之后并没有什么线索。

使用 cmdline、netscan 搜索命令行、套接字也没什么信息。

获取 dump 内存时的屏幕信息

这时候要换一种思路,试试能不能获得 dump 该内存时的屏幕信息,寻找线索。

可以用到 linux 下的一款图形工具 gimp

将刚刚 dump 下来的进程后缀名改为data,随意打开一个,例如 mspaint.data。一般电脑屏幕的分辨率是 1920x1080,按此更改图片的宽和高。调整偏移值大小,然后细微调整,在 46981633 处得到完整的图片。

eazy_dump_1

注意这里宽不能有一点偏差,否则无法获得正确信息,高无所谓。

eazy_dump_2

可以看到运行了扫雷、记事本和画图。记事本中有 im so boring,后面可能还有一些内容,被扫雷挡住无法看到。画图中完全不知有什么内容。

分析 wordpad

strings -e l 单字小端位序的方式输出进程 wordpadim so boring 前后的字符串查找线索。

1
$ strings -e l 1804.data | grep -C 5 im\ so\ boring
1
2
3
4
5
6
7
8
9
10
11
12
13
14
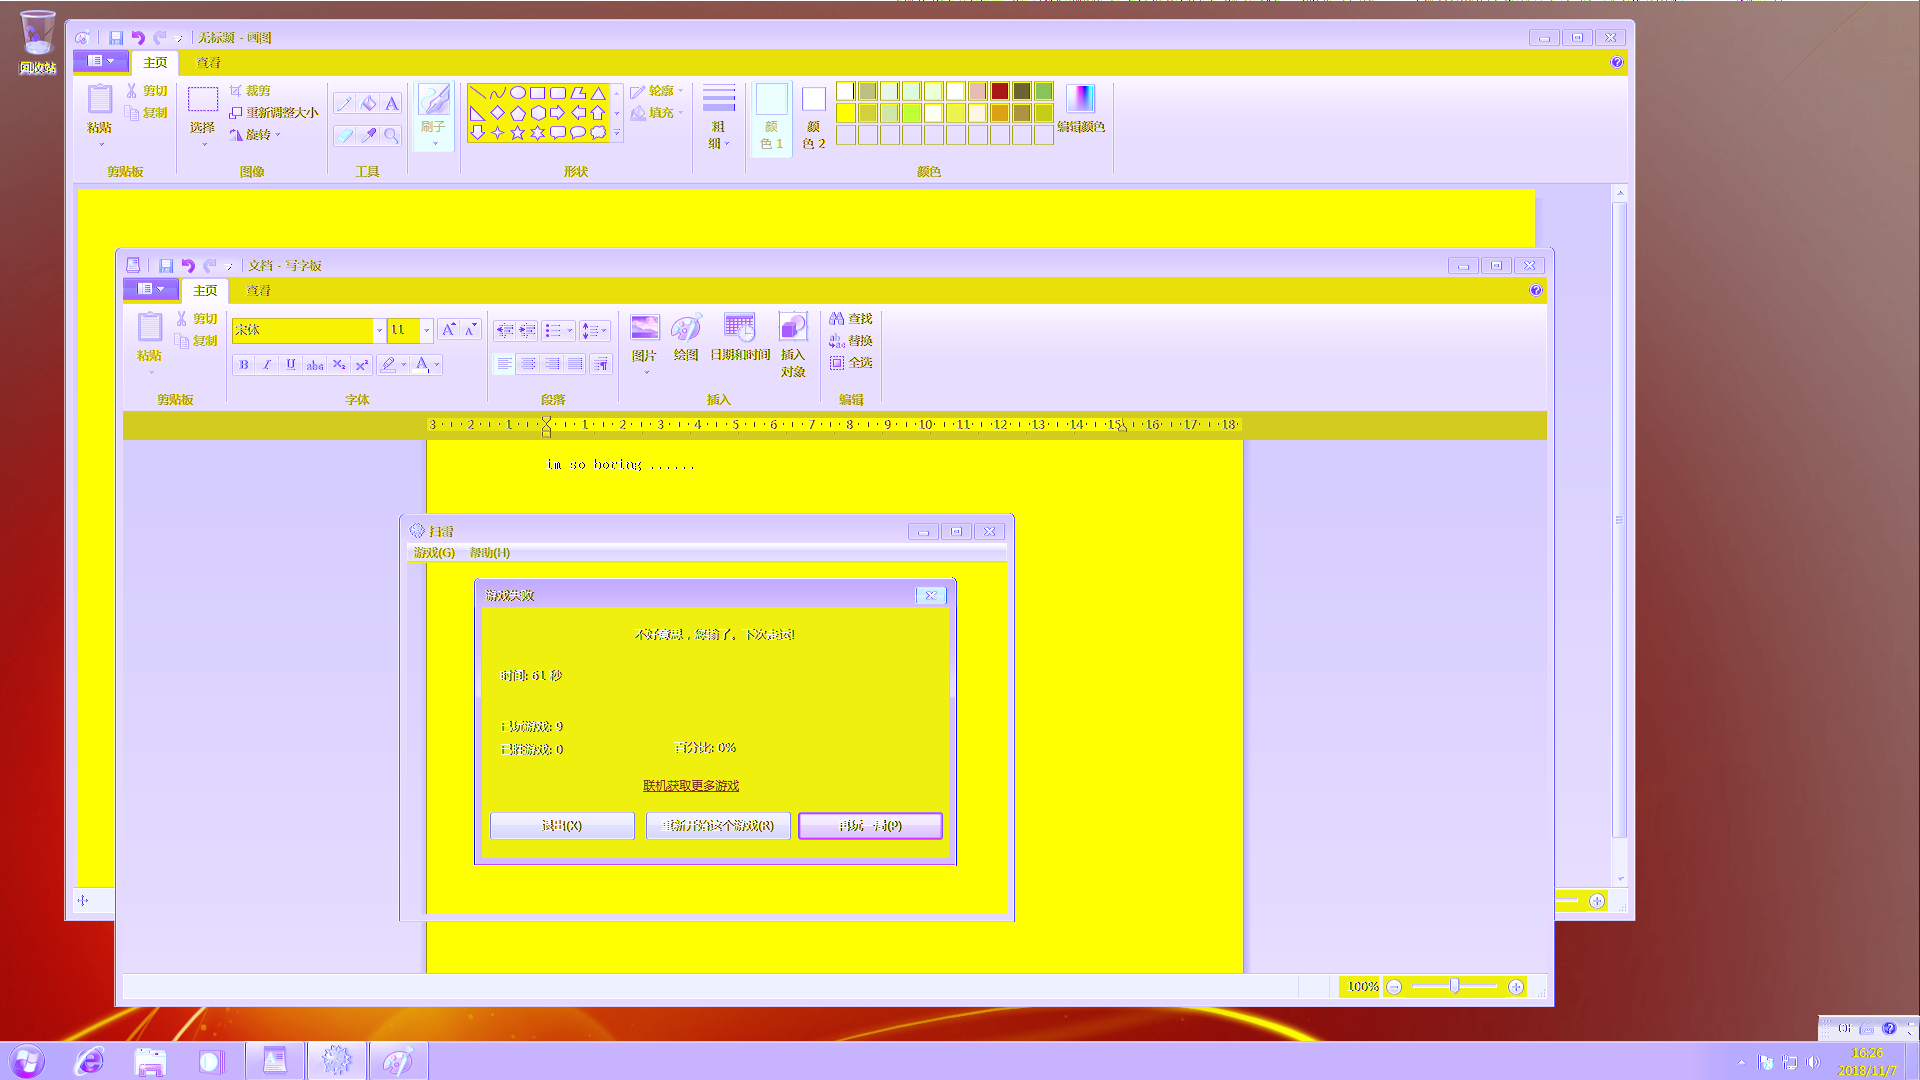
ijaya
Vani
DokChampa
DaunPenh
im so boring ...... art??
Malgun Gothic
Shonar Bangla
im so boring ......
btw ..
ike my art??
btw ..
do you like my art??
!"#$%&'()*+,-./0123456789:;<=>?@ABCDEFGHIJKLMNOPQRSTUVWXYZ[\]^_`abcdefghijklmnopqrstuvwxyz{|}~

可以看到 do you like my art?? 的提示,线索指向了 mspaint

分析 mspaint

通过桌面图片可以得到 mspaint 的画布宽为 1457

然后用 gimp 打开 mspaint.data,设置宽为 1457,高度随意。不断调整偏移值最后在 152281183 处得到图片:

eazy_dump_3

最终得到 flag:
hctf{big_brother_is_watching_you}